Unaddressed Situation – How 2020 Election Results Were Altered
Оставайтесь в курсе последних событий! Подписывайтесь на наш канал в Telegram.
1. Anomalies in 2020 vote counting
From the time of 2020 election, the discussion of Trump’s loss has never ended, because such a loss was and still is critical. In my opinion, there is a misunderstanding of what exactly happened. For example, in the excellent article (1) published at the end of 2020 (see at https://votepatternanalysis.substack.com/p/voting-anomalies-2020), there is a thorough analysis of the abnormality of the election statistics. Statistics are like fingerprints – anomalies means cheating. However, it is not clear how criminals had broken in. That is – the method of alteration. Without such understanding there is a very high risk of being cheated again in “swinging states” which are to decide the fate of the 2024 elections.
In true election data, statistics are very similar during the entire voting time – from start to finish. That is “stationary statistical process”. For instance, as we discuss below, for 16 hours of the data collection and 315 data samples within each of 3 minutes time intervals statistics are expected to be very close. That is like shots of a professional sniper – all clustered inside the bullseye circle. However, if an intruder steps in and shakes sniper’s shoulder, the bullet will travel far away from the target.
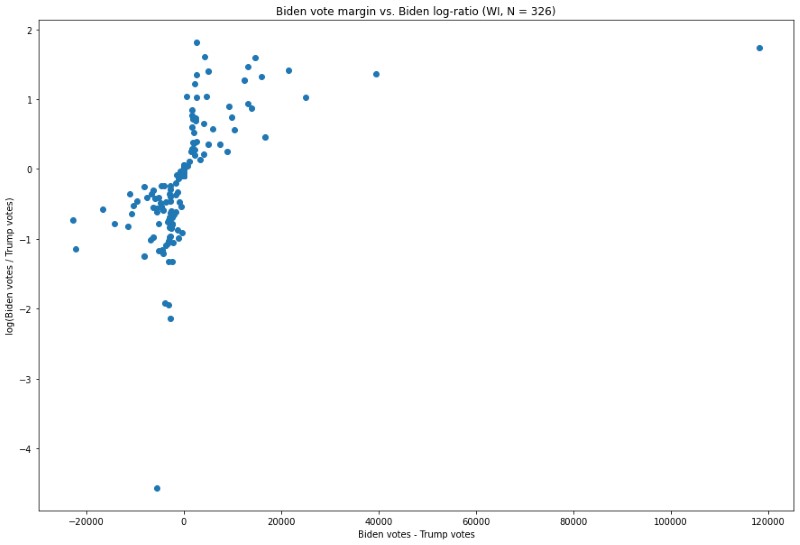
Fig.1. Distribution of datasets in Wisconsin from the article (1)
That is what we see in the article (1) as distribution graphs. Each graph has such “missed” shots. Above, there is such graph (Fig. 1) for Wisconsin where we see the dot in the right upper corner. There are anomalies in numbers for four “swinging” states (quote):
“The four vote updates in question are:
1. An update in Michigan listed as of 6:31AM Eastern Time on November 4th, 2020, which shows 141,258 votes for Joe Biden and 5,968 votes for Donald Trump.
2. An update in Wisconsin listed as 3:42AM Central Time on November 4th, 2020, which shows 143,379 votes for Joe Biden and 25,163 votes for Donald Trump.
(Comment: This dataset is the rightmost dot on the graph above and it is far away from others, and it gave Biden 118,216 in one 3-minutes “shot”.)
3. A vote update in Georgia listed at 1:34AM Eastern Time on November 4th, 2020, which shows 136,155 votes for Joe Biden and 29,115 votes for Donald Trump.
4. An update in Michigan listed as of 3:50AM Eastern Time on November 4th, 2020, which shows 54,497 votes for Joe Biden and 4,718 votes for Donald Trump.”
All above listed critical for the election datasets happened – by the timestamp – during after regular voting hours at overnight time. Considering information about absentee letters processing, we concluded that it should be manual tabulation process – one by one bulletin. However, it is not possible to process manually such number of bulletins – 147,226 or 168,542 or 165,270 or 59,215 – during the time interval between datasets of a few minutes. That is going to be electronic processing – hacking of the voting machine. We believe that similar happened in all swinging states but we will limit our analysis to one only – Wisconsin.
We have been checking periodically but the situation did not change and there were not too many votes counted. Somewhere around 2 am we went to bed. The computer, of course, was not turned off. In the morning we immediately checked, and were amazed – somewhere around 3 – 4 AM the blue line jumped vertically upwards by about 3–5% above the red one, and continued to go like that. Trump lost this state. And others “swinging” as well in a similar way. Below, there is one more graph for the state of Michigan (Fig. 3) and it is very similar to Wisconsin having jumping abnormalities almost at the same place in the middle of the graph.
Comments to the graph Fig.2:
1. The time in the graph above starts from around 10 pm meaning that it is not a real time processing.
That is not really critical because each dataset has its timestamp.
2. The jump on 4am is about 120,000 for Biden within 3 minutes, which we mentioned in our Comment above.
3. We see that there is one big jump up and two smaller before and later – a sort of “correcting” the uncertainty and moving Biden a bit up. Just to make sure he would not lose this state. Smart people!
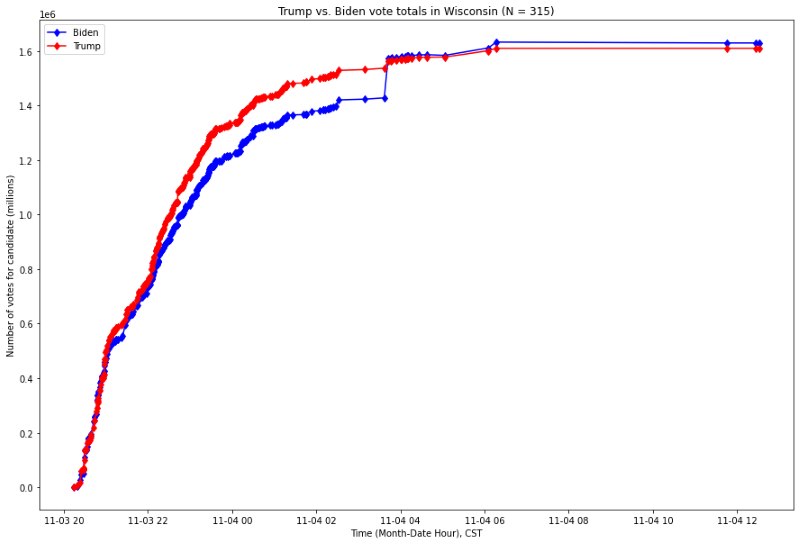
Fig.2. Votes counting graph in Wisconsin
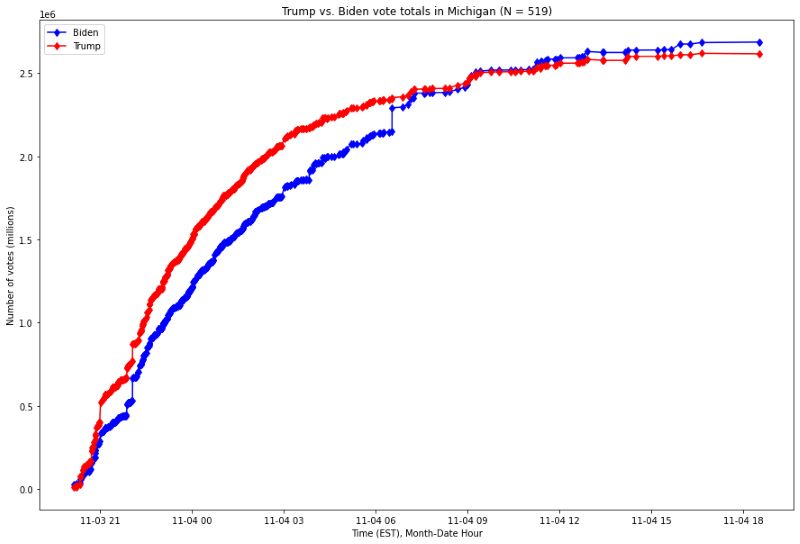
Fig.3. Votes counting graph in Michigan
2. Did such graphs’ jumping happen during manual or electronic feed of bulletins?
We see such jumps in a very short time and actually during one dataset. In Wisconsin Fig.2 above there were 315 datasets. The total time of processing was 16 hours. Therefore, it was one dataset in about 3 minutes with the total “jumping” votes processed 168,542. Such value represents the votes’ counted in REAL TIME as each dataset is an update which came in the system at a certain time. It was 3:42 am on November 4th. In REAL TIME it was 8 hours after the beginning of the voting that is around 4 pm on November 3d. At such time all voting stations were operating in MANUAL mode counting bulletin by bulletin. It should be no electronic massive data input at such time.
In general, the absolute timestamp of jumping data input is not important. The point is the amount of data and the time interval, which is the period between data sets and is about 3 minutes.
In the US, in 2020 there were approximately 240 million eligible voters. That is 240/330 ~ 73% of the population.
Let’s take the state of Massachusetts (where we live and vote) as an example. This is good enough for a rough estimate. The population here is about 7 million. In our town, we have about 10 voting machines for almost 20,000 people population and 14,000 voters. That is one machine per 2,000 people and 1,400 voters. In the state it should be 7,000,000/2,000=3,500 machines. It gives approximately 30 seconds per voter during 12 voting hours (12×60/1,400) if everybody comes to vote and no absentees.
There were approximately 3.6 million voted in Massachusetts in 2020. That is very close to Wisconsin number of voters – approximately 3.2 million. Therefore, situation with voting machines should be fairly similar – around 3,500.
Therefore, the discussed dataset was processed ELECTRONICALLY instead of real paper bulletins! That was not MANUAL processing of bulletins. Needless to say, that the ratio between Biden and Trump was simply unreal. In general such ratio should be with some variations between 52 – 48 (or at most 60 – 40) in each dataset. Please see the table below for voting differences in swinging states.
| State | Votes for Biden % | Votes for Trump % | Difference %% | Difference in votes |
| Arizona | 49.4 | 49.0 | 0.4 | 10,457 |
| Georgia | 49.5 | 49.2 | 0.3 | 11,779 |
| Michigan | 50.6 | 47.8 | 2.8 | 154,188 |
| Pennsylvania | 50.0 | 48.8 | 1.2 | 81,660 |
| Wisconsin | 49.6 | 48.9 | 0.7 | 20,682 |
3. Analysis of data for Wisconsin for How and Where
Wisconsin is, so to say, in the middle of these five states – by both the percent difference and by votes. Let’s see what happened both in 2016 voting (Trump won) and 2020 (Biden won). This state has significant number of counties – 72 that helps to get more reliable statistics and to see how voting happened.
We will compare the voting in 2016 (when democrats were sure of Clinton winning and therefore unlikely were preparing and used the alteration of votes) and 2020 when perfectly crafted alteration won the sit for Biden.
We used voting information from:
1. For Trump-Clinton 2016 https://www.politico.com/2016-election/results/map/president/wisconsin/
3. The population of each county for 2016
4. The population of each county in 2020
https://beautifydata.com/united-states-population/by-county/wisconsin/estimate/2020
We skip other candidates for some simplicity.
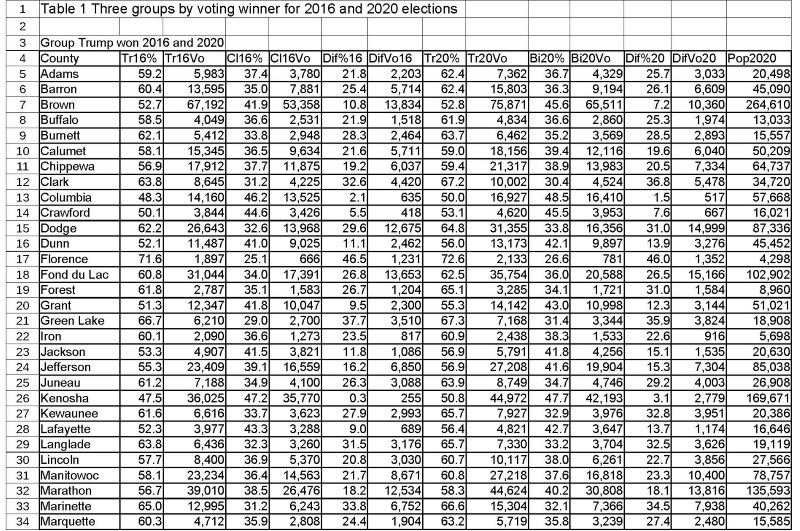
Information from four sources represented in Table 1, which has the following parts:
1. Counties where Trump won in 2016 and 2020 – total of 58
2. Counties where Clinton and Biden won (2016 and 2020) – total of 13
3. Counties where Trump won in 2016 and lost in 2020 – 1
A – counties in alphabetic order in each group
B (Tr16%) and C (Tr16Vo) – percent votes for Trump and the number of votes in 2016
D (Cl16%) and E (Cl16Vo) – percent votes for Clinton and the number of votes in 2016
F (Dif%16) and G (DifVo16) – difference in percent of votes and the number of votes (Trump minus Clinton) in 2016
H (Tr20%) and I (Tr20Vo) – percent votes for Trump and the number of votes in 2020
J (Bi20%) and K (Bi20Vo) – percent votes for Biden and the number of votes in 2020
L (Dif%20) and M (DifVo20) – difference in percent of votes and the number of votes (Trump minus Biden) in 2020
N (Pop2020) – population for 2020
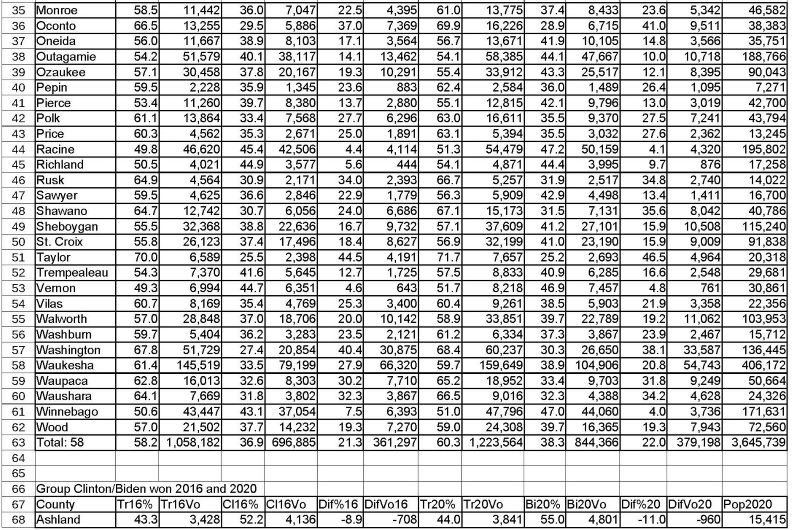
Some general results of the Table 1 consideration comparing two elections:
1. The number of counties voting for Biden in 2020 did not change (13) since Clinton in 2016 and is 4.5 times less than counties voting for Trump (59 in 2016 and 58 in 2020)
2. Only one county has changed mind and voted for Biden in 2020 with population of approximately 28 thousand people.
The consideration of average values of votes’ percent (Tr16%, Tr20%, Cl16% and Bi20% in Table 1) gives interesting results as below.
Election 2016
In the part of counties (59) where Trump won both 2016 and 2020 :
1. The average percent voting for Clinton 2016 was 36.9. Per a county it is 36.9/59=0.63
2. The average percent voting for Trump 2016 was 58.2. Per a county it is 58.2/59=0.99
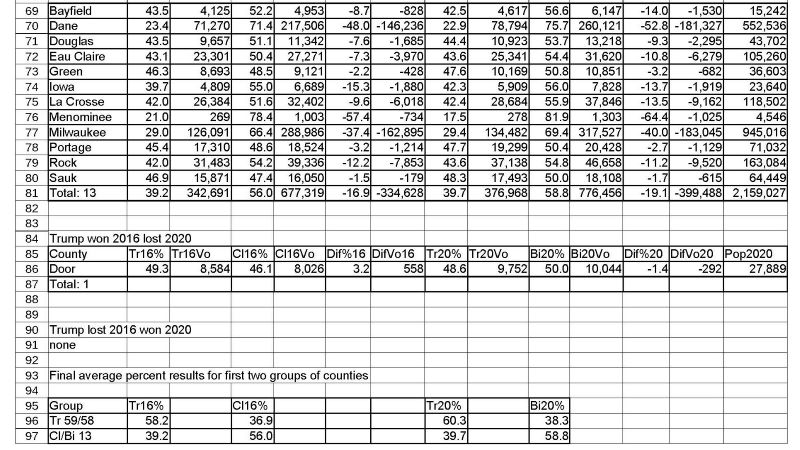
In the part of counties (13) where Clinton 2016 and then Biden 2020 won:
1. The average percent voting for Clinton 2016 was 56.0. Per a county it is 56.0/13=4.31
2. The average percent voting for Trump 2016 was 39.2. Per a county it is 39.2/13=3.02
Election 2020:
In the part of counties (58) where Trump won both 2016 and 2020
we have:
1. The average percent voting for Biden 2020 was 38.3. Per a county it is 38.3/58=0.66
2. The average percent voting for Trump 2020 was 60.3. Per a county it is 60.3/58=1.04
In the part of counties (13) where Clinton 2016 and then Biden 2020 won:
1. The average percent voting for Biden 2020 was 58.8. Per a county it is 58.8/13=4.52
2. The average percent voting for Trump 2020 was 39.7. Per a county it is 39.7/13=3.05
It is most interesting that in comparison to 2016 voting in 2020 almost did not change in 58 counties preferring Trump. The average percentages are: Clinton – 0.63 and Biden – 0.66 with Trump 0.99 and 1.04. Biden added 0.03 in 2020 and Trump 0.05. Thus, Trump got 1.7 times more than Biden. However, the average percentages in pro-democrats 13 counties are: Clinton 2016 – 4.31 and Biden 2020 – 4.52, therefore Biden in 2020 added 0.21. Trump had very stable results adding in 2020 only 0.03 (2016 – 3.02 and 2020 – 3.05). That is 7 times less than Biden. This shows a completely different voting statistics between two groups in 2020.
That basically means that a significant number of votes in 2020 were added for Biden only and in counties voting for democrats. That is what we saw in Fig. 1 at the beginning of the article. Votes were electronically inserted as we discussed.
Hiding of such operations is much easier to do when the population is larger. Therefore, it makes sense to sort out counties by population and then check for any interesting outcome.
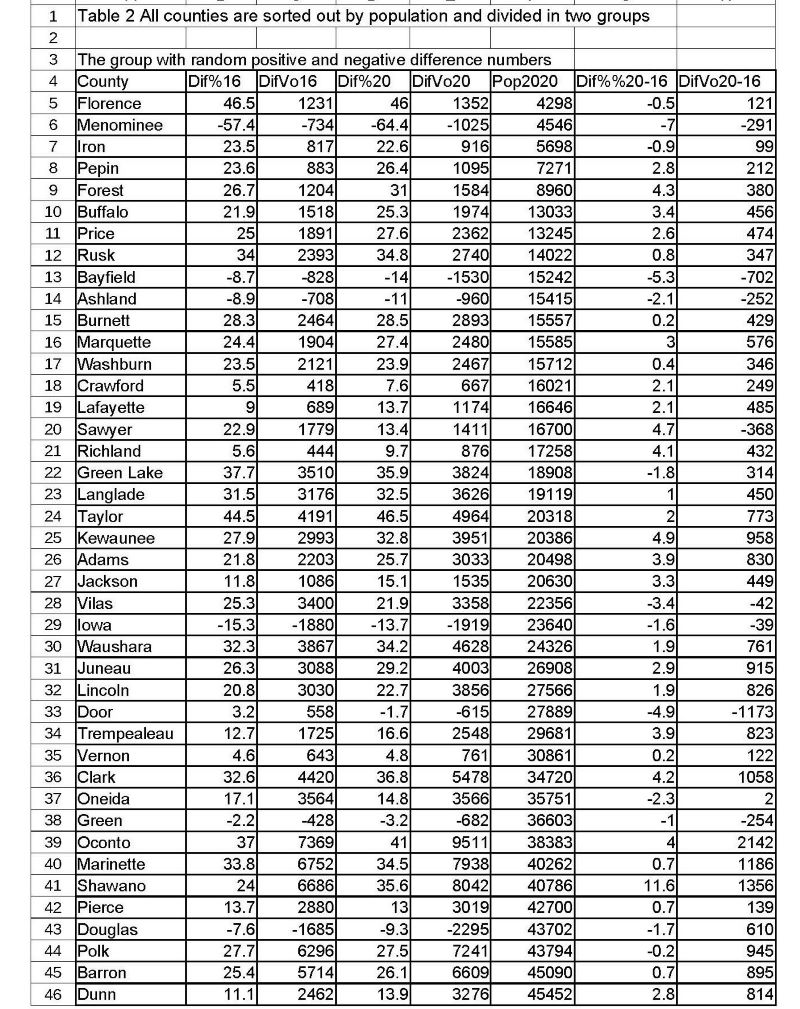
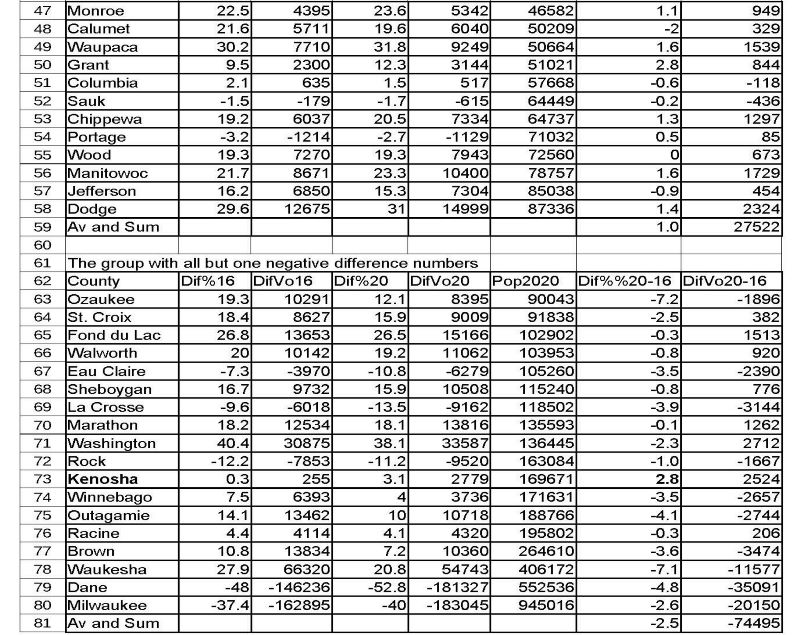
Table2 represents such an ascending sorting by a county population for all Wisconsin counties. It has the following columns:
A – county
B – (Dif%16) – difference between percent of votes for Trump and Clinton (Tr16% – Cl16% Table 1)
C – (DifVo16) – difference in votes for Trump and Clinton (Tr16Vo – Cl16Vo Table 1)
D – (Dif%20) – difference between percent of votes for Trump and Biden (Tr20% – Bi20% Table 1)
E – (DifVo20) – difference in votes for Trump and Biden (Tr20Vo – Bi20Vo Table 1)
F – (Pop2020) – population for 2020 which has been used for the sorting
G – (Dif%%20-16) – difference of percent of votes between 2020 and 2016 for Trump (Dif%20
– Dif%16)
H – (DifVo20-16) – difference of votes between 2020 and 2016 for Trump (DifVo20 – DifVo16)
We noticed that the difference of percent of votes between 2020 and 2016 for Trump (column G) above Ozaukee county (population 90,043) fluctuates randomly between negative and positive numbers and below are almost all negative. The exception is Kenosha county (+2.8). We then separated these two groups and calculated the average percent of the difference. The first group of 53 counties has +1.0. The second group of 19 counties has -2.5.
That definitely points to how the alteration happened. It is much easier to hide the influx of data where there are big number of votes. The alteration very likely happened in 18 counties but somehow Kenosha escaped such process. Statistically, it is highly unlikely that in such organized group of counties everyone decided to vote against Trump either switching to Biden or significantly increasing the support when compared to 2016, just because they have the population over 90 thousand!
There are three counties at the bottom of the table which provide the most of the votes loss – Waukesha (11,577), Dane (35,091) and Milwaukee (20,159). Together they have stolen 66,818 votes – 90% of negative votes moved to Biden. Ironically, one of three of the most active was Milwaukee where Republican National Convention just finished. Therefore, these counties require special attention during the voting day and after.
Similar hacking process of voting Dominion LLC machine has been shown in the courtroom, see https://www.ajc.com/politics/witness-shows-how-to-tamper-with-georgia-elections-in-security-trial/WUVKCYNV3ZGOVNB6X6TDX2GEFQ/
“Halderman, a University of Michigan computer scientist, changed results of a hypothetical referendum on Sunday alcohol sales. He flipped the winner in a theoretical election between President George Washington and Benedict Arnold, the Revolutionary War general who defected to the British. He rigged the machine to print out as many ballots as he wanted. All he needed was a pen to reach a button inside the touchscreen, a fake $10 voter card he had programmed, or a $100 USB device that he plugged into a cord connected to a printer, rewriting the touchscreen’s code.”
4. Conclusion
What has been done in 2020, can be easily repeated in 2024 – machines are the same and people are the same as well. And the only one way we can avoid such hacking – to disconnect voting stations during voting time and after from Internet or prevent any outside connection to them. That is quite a challenging task considering the number of voting machines in four swinging states.
I wish Donald Trump all the Good Luck but we are facing real technical and organizational challenge to get through 2024 voting without fraud.
References:
1. https://votepatternanalysis.substack.com/p/voting-anomalies-2020 Anomalies in Vote Counts and 13
Their Effects on Election 2020. A Quantitative Analysis of Decisive Vote Updates in Michigan, Wisconsin, and Georgia on and after Election Night, November24, 2020.
Mikhail Utin, CISSP, PhD
Комментариев нет:
Отправить комментарий